Part 2 — Supercharge your Monitoring: Migrate from Prometheus to VictoriaMetrics for optimised CPU and Memory usage

What is VictoriaMetrics
VictoriaMetrics stands as a resilient and high-performing time-series database meticulously crafted to address the requirements of contemporary monitoring and data analytics. Despite its parallels with Prometheus, VictoriaMetrics distinguishes itself through a range of improvements, positioning it as an appealing option for organizations in pursuit of streamlined, scalable, and budget-friendly solutions.
Utilizing a microservices framework, robust availability, exceptional performance, and cutting-edge data compression, VictoriaMetrics provides users with a contemporary time-series database adept at efficiently managing demanding monitoring and analytics duties. Its alignment with the Prometheus ecosystem, encompassing metric format and Prometheus objects, coupled with its open-source approach and cost-effective design, positions it as an appealing choice for those in search of an enhancement or alternative to their existing monitoring and data storage solutions.
VictoriaMetrics advantages over Prometheus
VictoriaMetrics (VM) is a powerful, open-source, and feature-rich platform designed to address the growing demands of modern monitoring and time series data analysis. With a focus on efficiency, scalability, and data integrity, VM offers a wide range of features that cater to the needs of both small-scale deployments and large, high-cardinality environments. This document provides a detailed overview of VictoriaMetrics and its key features.
1. Low RAM Usage
One of VictoriaMetrics’ standout features is its ability to efficiently manage system resources. When dealing with millions of unique time series, commonly referred to as high cardinality data, VictoriaMetrics requires only a fraction of the RAM compared to Prometheus. This efficient use of memory resources makes it suitable for environments where resource constraints are a concern.
2. High Latency IO and Low IOPS Optimization
VictoriaMetrics is optimized for high-latency IO and low IOPS (Input/Output Operations Per Second) environments. This includes compatibility with HDDs and network storage solutions in cloud platforms like AWS, Google Cloud, and Microsoft Azure. This optimization ensures that VictoriaMetrics can perform well in diverse storage configurations.
3. High Data Compression
VM excels in data compression, allowing it to store more data points in limited storage space. Compared to TimescaleDB, VictoriaMetrics can cram up to 70 times more data points into storage. Moreover, it requires up to 7 times less storage space than Prometheus for the same dataset, which translates to significant cost savings and efficient storage management.
4. High Performance and Scalability
VictoriaMetrics is designed for high performance and offers excellent vertical and horizontal scalability for both data ingestion and querying. This ensures that the platform can handle growing workloads and expanding data volumes without compromising on responsiveness and efficiency.
5. Easy Backups
VictoriaMetrics simplifies data backup with easy and fast options, including instant snapshots and backup to cloud storage services such as S3 (Amazon Simple Storage Service) and GCS (Google Cloud Storage). The vmbackup and vmrestore tools make data protection and recovery straightforward.
6. Data Integrity Protection
VM safeguards data integrity even in the face of unclean shutdowns due to out-of-memory errors, hardware resets, or abrupt termination with kill -9 signals. This protection is made possible through VictoriaMetrics’ resilient storage architecture.
7. Prometheus Compatibility
VictoriaMetrics supports the Prometheus querying API, making it an excellent drop-in replacement for Prometheus in Grafana environments. This compatibility simplifies migration and allows users to leverage the benefits of VictoriaMetrics without extensive configuration changes.
8. MetricsQL: Extended Query Language
VictoriaMetrics introduces MetricsQL, a query language built upon PromQL. MetricsQL extends the functionality of PromQL, offering enhanced capabilities for querying and analyzing time series data. This opens up new possibilities for users seeking advanced data insights.
9. Microservice Architecture
VictoriaMetrics follows a microservice architecture, with dedicated components for each functionality. This design allows for individual scaling of components to meet specific performance needs. Key components include VmAgent for scraping, VMStorage for data storage, VmSelect for querying, and VmAlert for rule execution.
VictoriaMetrics & Prometheus Benchmark
Current State
At present, Prometheus functions as a monolithic application, consolidating various operations within a single software entity. Its main responsibilities include gathering data through scraping, executing predefined rules, and presenting the resultant data on dashboards for querying and visualization. Nevertheless, this architectural approach poses difficulties related to resource management. The application tends to utilize substantial CPU and memory resources, potentially leading to performance bottlenecks. Additionally, it hinders horizontal scaling capabilities.
Factors which are responsible for High resource utilization of prometheus are as listed below
- Active Time Series
- Rule Evaluation
- High Cardinality
Certainly, let’s consider a scenario involving a stage Prometheus deployment and optimize the above 3 factors and run the prometheus stage with as minimal footprint as possible.
Current Resource Utilization
CPU: 24.9 core + 52.6% Throttling = 38 Core
Memory: 48 Gi
Target: 1.5 K
Grafana reference
Current Rules
In current setup of prometheus in staging we have 1610 rules
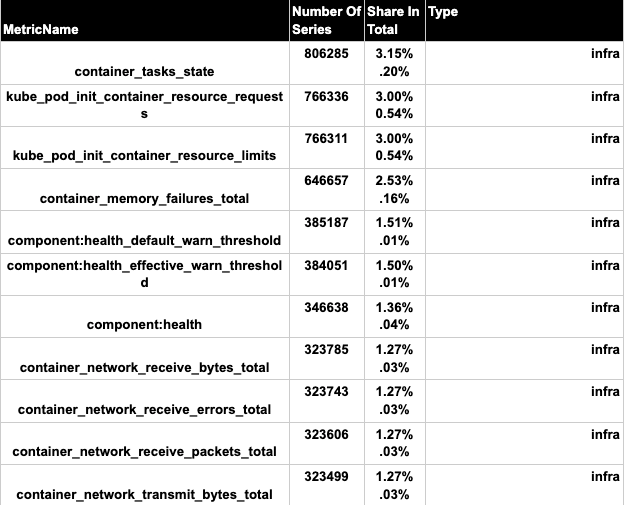
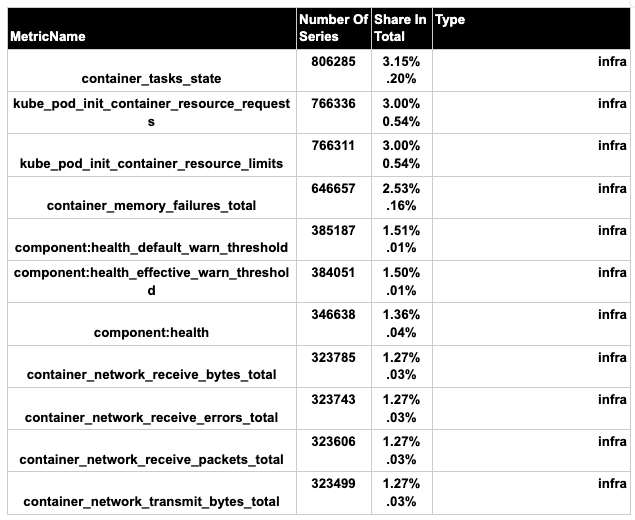
Current High Cardinal Metrics
In the current setup of prometheus in staging we have below metrics that have high cardinal data.
Optimization Phase-1 (Remove Duplicate Rules)
Presently, Prometheus manages 1610 alerts, and a notable issue arises from multiple duplicate alerts. This includes redundant alerts like infrastructure-related (container CPU, memory usage, CPU throttling, Kubernetes pod restart), OMS alerts, spring-boot alerts, and health check alerts. These alerts share common thresholds and frequently trigger across namespaces and applications, leading to substantial memory consumption. To enhance efficiency, a central approach will be adopted. Alerts will be consolidated and triggered centrally, notifying users only upon threshold breaches. This strategy aims to optimize memory usage while still ensuring timely and relevant alert notifications.
Phase-1 Resource Utilization
CPU: 12.5 + 25.1% Throttling = 16 core
Memory: 21.5 Gi
Target: 1.5 K
Rules
After removing duplicate alert rules we have reduced number of alerts from 1610 to 324
Result after phase-1 optimization
CPU Usage:
Memory usage:
Grafana Reference
Phase-1 Conclusion
In conclusion, our efforts to streamline the Prometheus alerting system by eliminating duplicate rules have yielded significant results. Following the removal of redundant alerts, we observed a notable reduction in both CPU and memory utilization within the Prometheus environment. We have successfully mitigated the resource strain caused by duplicated alerts.
Optimization Phase — 2 (Remove High Cardinal Metrics)
Certainly, high cardinality is an important concept in Prometheus that refers to the uniqueness or diversity of labels attached to time series data. In other words, high cardinality occurs when there are a large number of distinct label combinations associated with your metrics. Each unique combination of labels increases the cardinality of the data set.
High cardinality can have significant implications for Prometheus’s performance, resource consumption, and query efficiency. It can lead to increased memory usage, longer query times, and even potential performance bottlenecks. This is because each unique label combination creates a separate time series that needs to be indexed, stored, and processed, adding to the overall complexity of managing the data.
What steps we took to remove high cardinal metrics
Metrics emitted by business clusters:
In the optimization process of metrics emitted by business clusters, the following metrics have been identified as top contributors:
1. Http_server_requests_seconds_bucket:
The metric is optimized by implementing the following steps:
- Restricting latency buckets to only 16.
- Removing the URI label.
- Eliminating the endpoint label.
2. Optimize Jvm Metrics:
The metric is optimized by implementing the following steps:
- Drop endpoint label from [path from where the metrics is read]
- Drop app label from [path from where the metrics is read]
- Drop few unused metrics
Drop few Probe metrics
- Probe_http_version
- Probe_failed_due_to_regex
- Probe_http_content_length
- Probe_http_uncompressed_body_length
- Probe_ip_addr_hash
- Probe_http_redirects
Drop few unnecessary label from below metrics
From metrics
- Probe_success
- Probe_http_status_code
- Probe_http_ssl
- Probe_ip_addr_hash
- Probe_duration_seconds
the below labels has been dropped by metric relabeling in service monitor
- Olympus_cluster_team
- Olympus_zone
- Olympus_zone_env
Metrics Emitted By Platform clusters:
In the optimization process of metrics Emitted By Platform clusters We have dropped unnecessary metrics which are collected by prometheus but these metrics are not used in any of the dashboard and alerts .
Phase-2 Resource Utilization
CPU : 9.27 + 15.8% Throttling = 10.5 core
Memory : 21.5 Gi
Target : 1.5 K
Result after phase — 2 optimization
Cpu usage:
Memory Usage:
Grafana reference:
Phase-2 Optimization Conclusion
Upon eliminating metrics with high cardinality, notable enhancements in both CPU and memory usage were observed. Furthermore, a reduction in CPU throttling was identified as a consequential outcome of this optimization.
Part 3: VictoriaMetrics v/s Prometheus
Part 1: Supercharge your Monitoring: Migrate from Prometheus to VictoriaMetrics for Scalability and Speed
Authors:
Vijesh Nair → linkedin.com/in/vijesh-nair-b651a2a1
Ritesh Sanjay →linkedin.com/in/riteshsanjaymahajan
Reviewers:
Shashidhar Soppin→ linkedin.com/in/shashidhar-soppin-8264282
Praveen Irrinki → linkedin.com/in/pirrinki
Shaik Idris →linkedin.com/in/shaikidris